森林图
说明
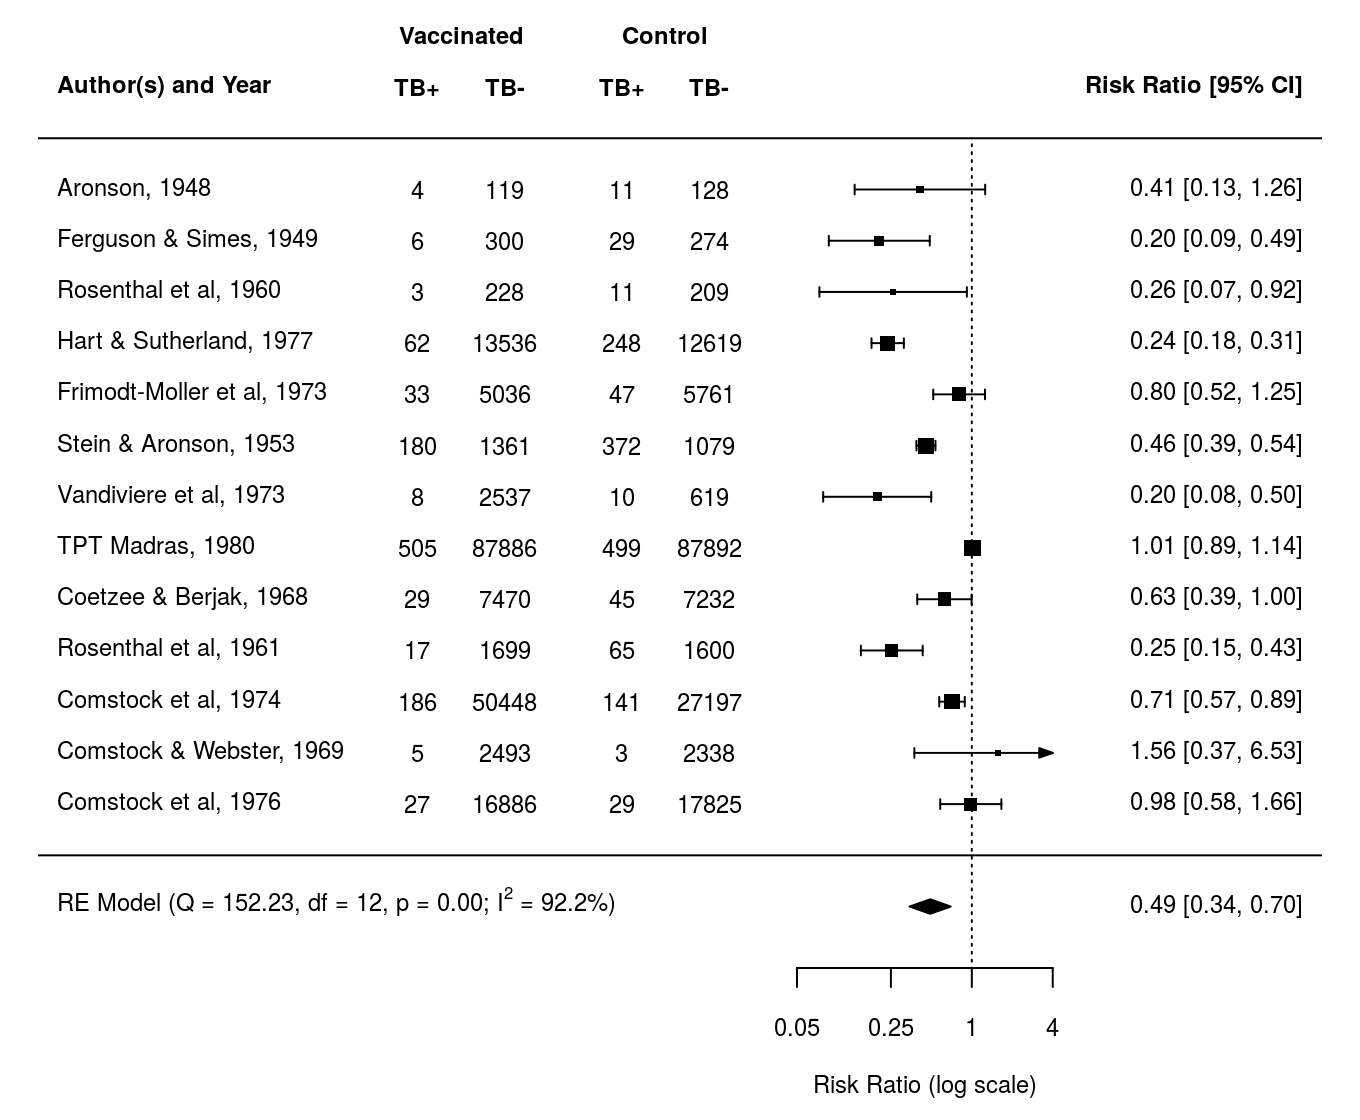
森林图是Meta分析中常用的可视化技术,它显示单个研究的结果(即估计的效果或观察到的结果)及其(通常为95%)置信区间。一个四边多边形(有时称为汇总‘菱形’)被添加到绘图的底部,显示基于模型的汇总估计值(多边形的中心对应于估计值,左/右边缘表示置信区间界限)。下面是这样一个森林图的例子。
图例
代码
library(metafor)

### copy BCG vaccine meta-analysis data into 'dat'
dat <- dat.bcg

### calculate log risk ratios and corresponding sampling variances (and use
### the 'slab' argument to store study labels as part of the data frame)
dat <- escalc(measure="RR", ai=tpos, bi=tneg, ci=cpos, di=cneg, data=dat,
              slab=paste(author, year, sep=", "))

### fit random-effects model
res <- rma(yi, vi, data=dat)

### forest plot with extra annotations
forest(res, atransf=exp, at=log(c(.05, .25, 1, 4)), xlim=c(-16,6),
       ilab=cbind(dat.bcg$tpos, dat.bcg$tneg, dat.bcg$cpos, dat.bcg$cneg),
       ilab.xpos=c(-9.5,-8,-6,-4.5), cex=.75, header="Author(s) and Year",
       mlab="")
op <- par(cex=.75, font=2)
text(c(-9.5,-8,-6,-4.5), 15, c("TB+", "TB-", "TB+", "TB-"))
text(c(-8.75,-5.25),     16, c("Vaccinated", "Control"))
par(op)

### add text with Q-value, dfs, p-value, and I^2 statistic
text(-16, -1, pos=4, cex=0.75, bquote(paste("RE Model (Q = ",
     .(formatC(res$QE, digits=2, format="f")), ", df = ", .(res$k - res$p),
     ", p = ", .(formatC(res$QEp, digits=2, format="f")), "; ", I^2, " = ",
     .(formatC(res$I2, digits=1, format="f")), "%)")))